Tampa Bay Rays 2019 Statistical Leaders – Offense


We take a look at the Tampa Bay Rays’ players who led the team in all sorts of categories with the bat in 2019.
This is pretty straight forward as we take a look at the Tampa Bay Rays offensive statistics from their 96-win season. We’ll list the leaders in your traditional stats and we might get a little weird with them, too. After all, this is baseball and what is baseball without some weird statistics?
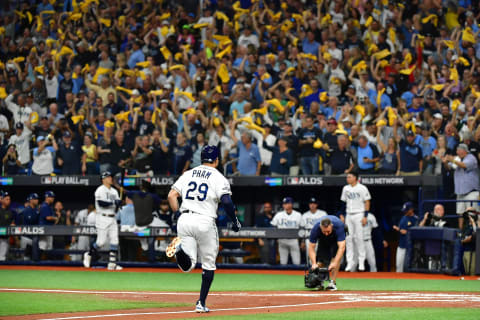
Hits – Tommy Pham led the team with 155 hits.
Singles – Tommy Pham once again led the Rays with 99 singles.
Doubles – Tommy Pham was the only Rays’ player to hit over 30 doubles in 2019, finishing with 33 two-baggers.
Triples – We had a tie with seven triples each between Kevin Kiermaier and Austin Meadows.
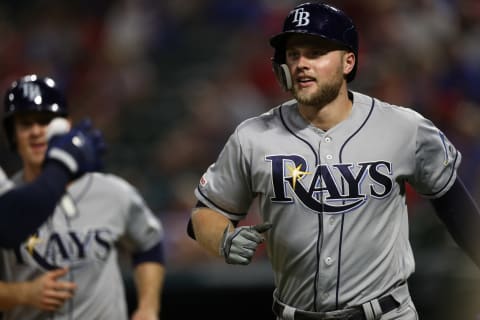
Home Runs – Austin Meadows paced the team with 33 round-trippers. He had twelve more home runs than the next closest player on the list. Newly acquired Hunter Renfroe had 33 last season for the Padres, and Yoshitomo Tsutsugo is notorious for his majestic big flies in Japan. There should be plenty of competition for Meadows this season!
Runs Scored – Austin Meadows led the club by touching home plate 83 times last season.
Runs Batted In – Austin Meadows again! It didn’t hurt that he drove himself in with one swing on 33 occasions.
Walks – Tommy Pham finished with 81 walks. He truly is a patient man. His 81 free passes were 17 better than Ji-Man Choi‘s 64, which was good for second best.
Intentional Walks – Austin Meadows was provided six bases with no attempt at getting him out last season. These are the freest of the free passes. Does anyone else miss having the pitcher throw the four balls? I hate the new way.

Strikeouts – Willy Adames led the team in whiffs with 153 and averaged just a hair over one strikeout per game.
Beanballs – Joey Wendle finished the season with the most bruises inflicted by opposing pitchers. He led the team with eight beanballs in only 263 plate appearances. Wendle led the team despite having 328 fewer plate appearances than the next closest player on the team.
Sacrifice Flyballs – Ji-Man Choi led the team with baseball’s version of falling on the sword. Choi finished with seven sac flies.
Grounded into Double Plays – Tommy Pham led the team by grounding into 22 double-play balls last season. That was good for seven more than second place on the team.
Stolen Bases – Tommy Pham paced the club with 25 thefts.
Caught Stealing – Austin Meadows wanted to keep pace with Pham but was gunned down seven times.
Batting Average – Austin Meadows finished with a .291 average last season. This was the best average for players who had more than five at-bats.
The following ratios require batters have at least 50 plate appearances to qualify.
Walk Percentage – Michael Perez was tops on the Rays in walk percentage, earning a free pass in a whopping 14.5% of his plate appearances.
Strikeout Percentage – Brandon Lowe had a great rookie season, but he did lead the team with a 34.6% strikeout percentage.
On-Base Percentage – Tommy Pham combined his team-leading 81 walks with a .273 average to take the OBP championship for the 2019 Rays.

Slugging Percentage – Austin Meadows absolutely crushed it last season with a .558 slugging percentage.
OPS – When you combine Meadows’ .364 OBP with his .558 SLG, nobody was even close to him in OPS.
wRC+ – Austin Meadows finished number one in weighted runs created. His 142 was 17 better than the next closest on the team.
Best Hitter vs. the Shift – Brandon Lowe posted a 129 wRC+ against the shift and also led the team in nearly every other category when facing the shift.
High Leverage Hitter – Kevin Kiermaier was the best hitter with more than fifty PAs in high leverage situations. He posted a .806 OPS when in high-leverage situations last season.
Best Leadoff hitter – The Rays love to switch the lineup around a lot, but Meadows was the most reliable leadoff hitter on the team, hitting .307 with 13 homers from the top spot.
Best DH – Austin Meadows was by far the best DH on the team. Not only did he see the most plate appearances as DH but he led the team in nearly every statistical category finishing with an .821 OPS and a 128 wRC+.
HR vs. LHP – Travis d’Arnaud led the team with 10 homers against southpaws.
OPS vs. LHP – Yandy Diaz finished tops on the Rays with a whopping .976 OPS against lefties.
AVG vs. LHP – Tommy Pham finished with a .340 against left-handers.
OBP vs. LHP – Tommy Pham got on base at an incredible .467 clip against left-handed pitching in 2019.
Line-drive Percentage – Brandon Lowe had a fantastic 26.9% line-drive rate. A high line-drive rate is a key to a consistently high batting average.
Hard-Hit Percentage – Michael Perez was tops on the team with 48.1% of hit batted balls registering as hard hit.
Road wRC+ – Austin Meadows at 149.
Home wRC+ – Yandy Diaz led the club in wRC+ with 143 at home.
Rays' career numbers against Yankees SPs. dark. Next
That’s enough from me folks. There are some interesting takeaways to be had here. I like seeing Michael Perez on the list a few times. What did you notice?